
We put three ignition coils on one 2022 Toyota Tacoma TRD Off-Road and measured every spark with a GTC505M ignition analyzer: the factory OEM coil, HighSpark Standard and HighSpark Premium. Above 3,800 RPM, most OEM sparks fell to the analyzer floor, while both HighSpark coils kept a measurable spark. The two charts below show where that happens.
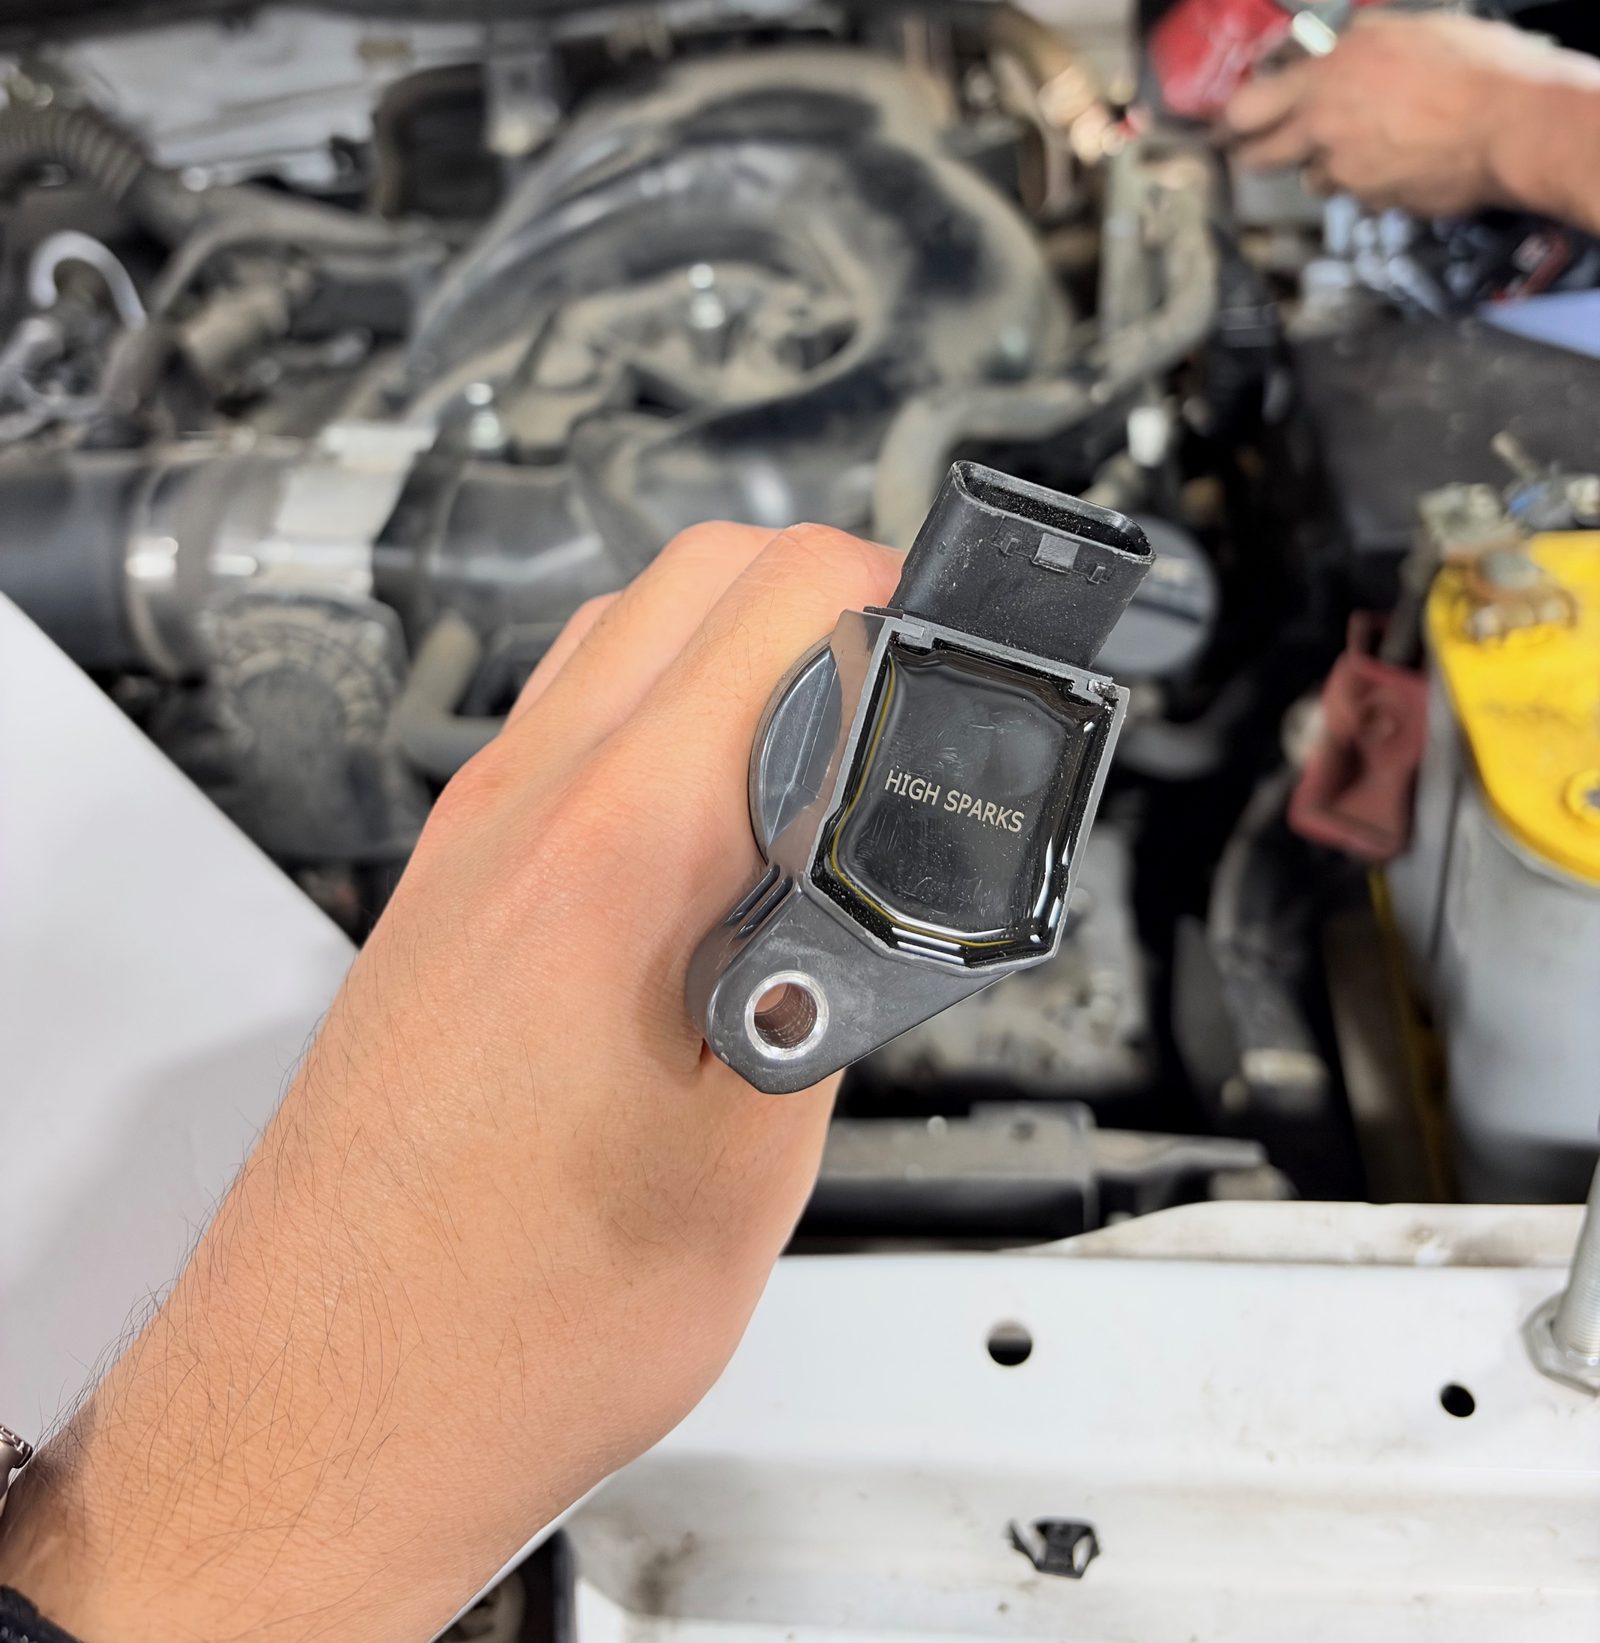
OEM spark voltage drops to the analyzer floor as RPM climbs
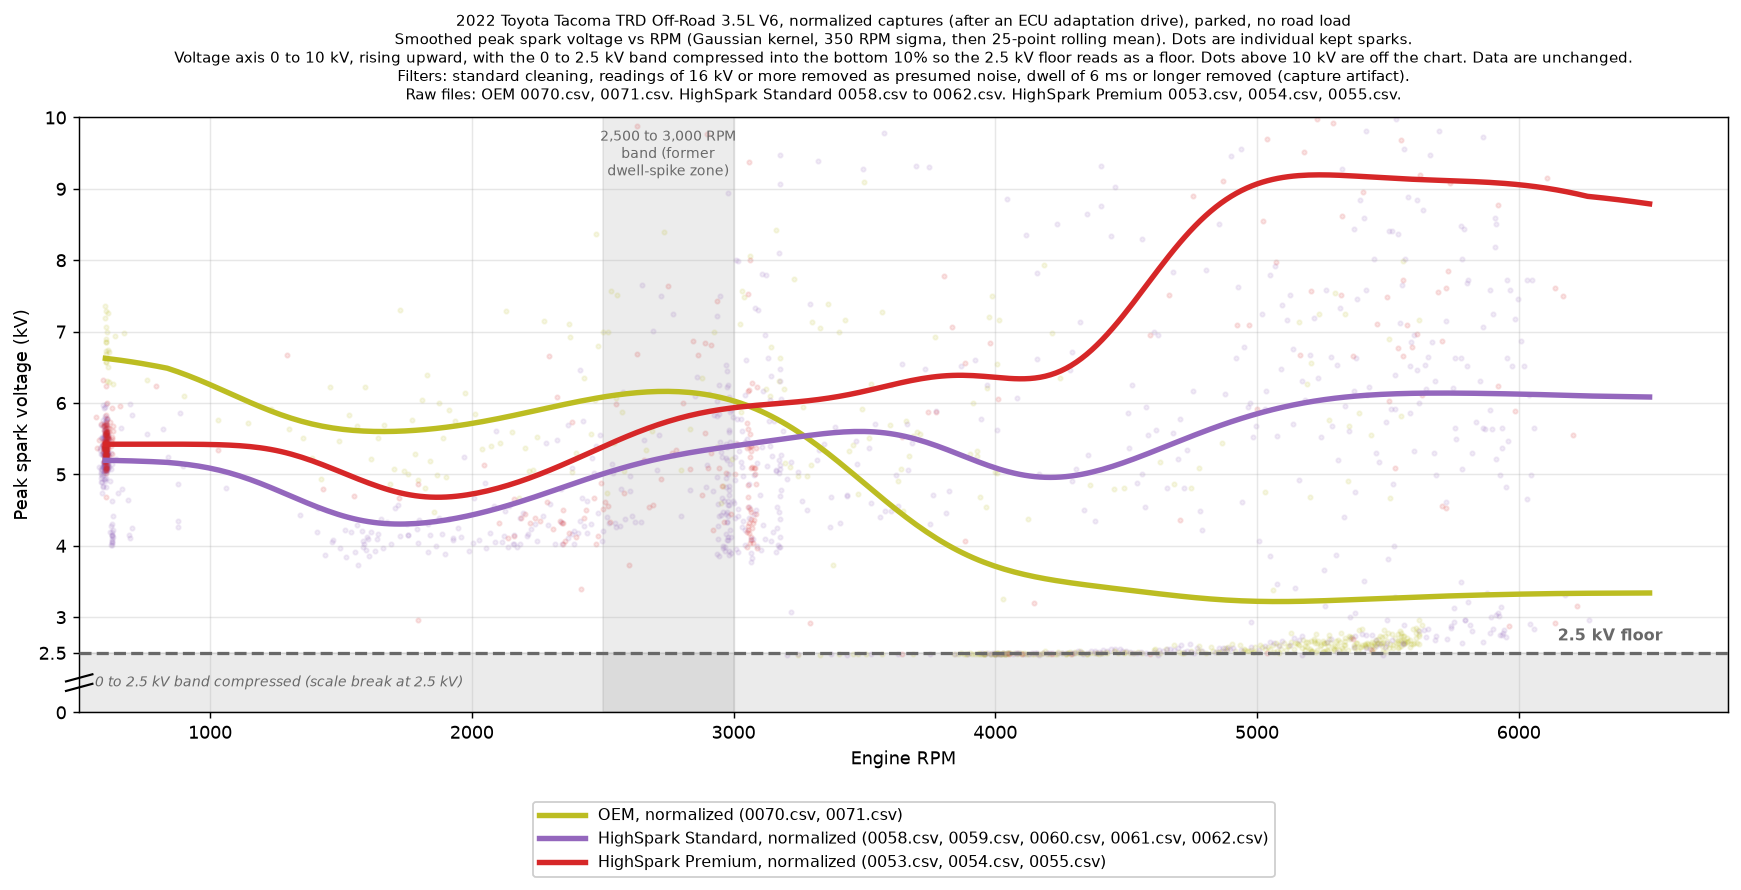
Figure 1. Smoothed peak spark voltage versus RPM for OEM (0070.csv, 0071.csv), HighSpark Standard (0058.csv to 0062.csv) and HighSpark Premium (0053.csv to 0055.csv), normalized captures, parked, no road load. The voltage axis runs from 0 to 10 kV, rising upward. The 0 to 2.5 kV band is compressed into the bottom 10% of the axis so the 2.5 kV analyzer floor reads as a floor; above 2.5 kV the scale is even. Single-spark dots above 10 kV are off the chart (119 of 1,897 kept sparks). Data are unchanged.
OEM coils pinned to the floor as RPM climbs
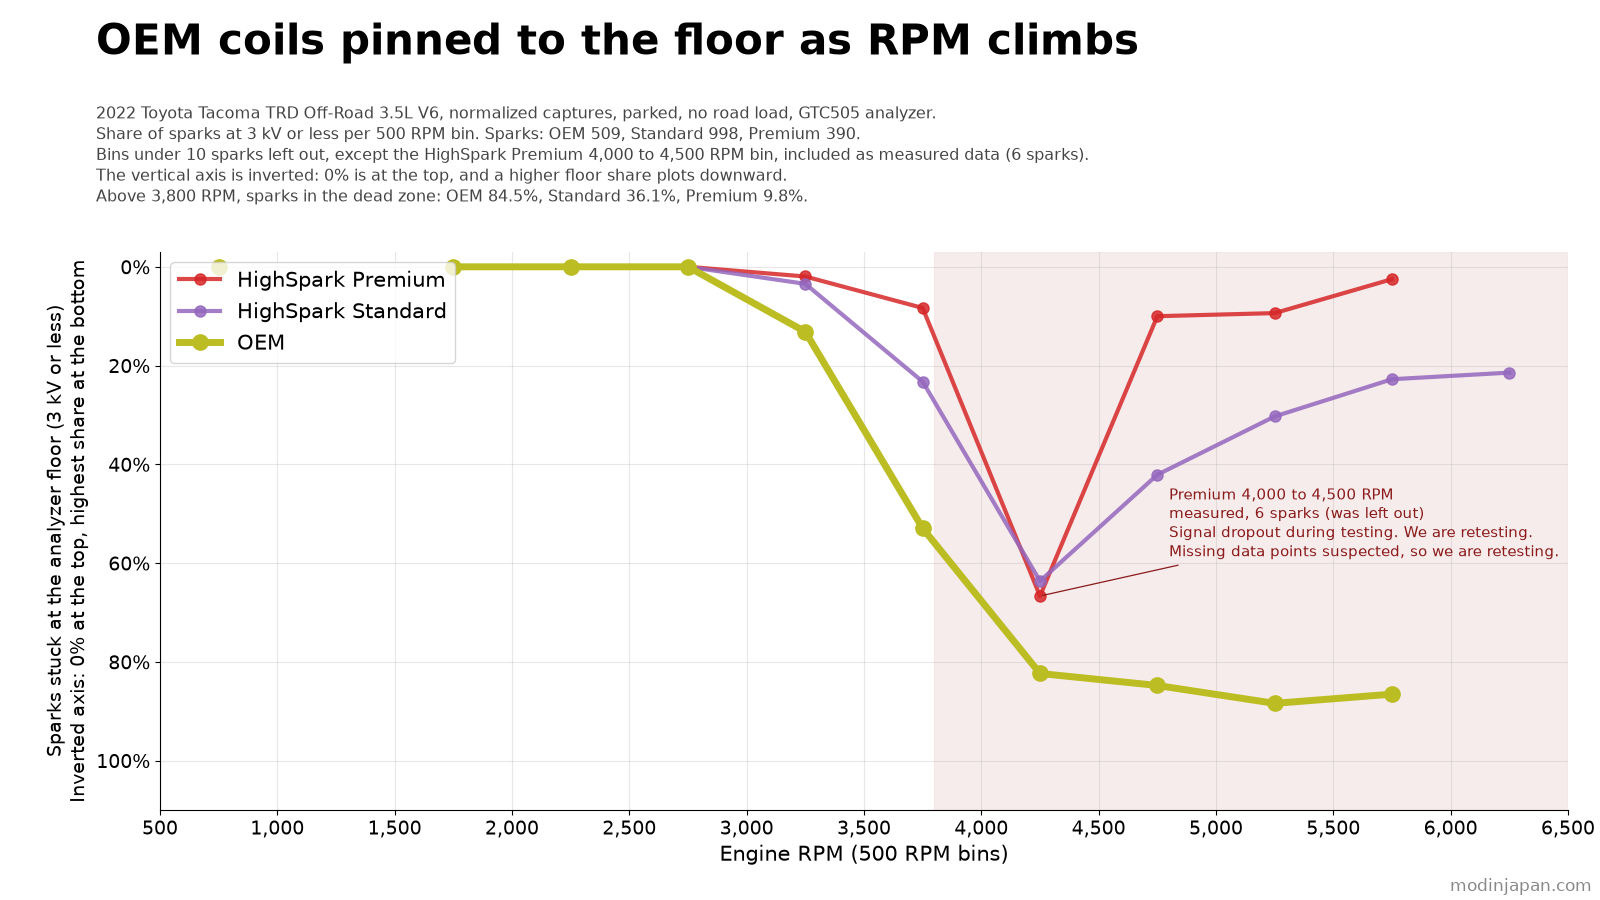
Figure 2. Share of sparks stuck at the analyzer floor (3 kV or less) by engine RPM, 500 RPM bins, for OEM (0070.csv, 0071.csv), HighSpark Standard (0058.csv to 0062.csv) and HighSpark Premium (0053.csv to 0055.csv), normalized captures, parked, no road load. The HighSpark Premium 4,000 to 4,500 RPM bin is included as measured data (6 sparks). The vertical axis is inverted, with 0% at the top.
Tested by Steven Tran, founder of Mod in Japan, and Bruce Amurao, owner of Wheelers Motorsports.
Abstract
We put three ignition coils on one truck and measured every spark with an analyzer: the factory (OEM) coil, HighSpark Standard (the street version) and HighSpark Premium (the race version). The truck is a 2022 Toyota Tacoma TRD Off-Road 3.5L V6, parked, with no road load, revved through its range. This is the first case study in a series. It is one truck, not the final word.
The result is clear in the upper rev range. Above 3,800 RPM, OEM sparks mostly dropped to the analyzer floor. Both HighSpark coils kept a measurable spark. The charts at the top of this page show it: peak spark voltage versus RPM, and the share of sparks stuck at the floor, by RPM, for all three coils.
Key findings (normalized captures, above 3,800 RPM):
- Median peak voltage: HighSpark Premium 8.26 kV, HighSpark Standard 5.31 kV, OEM 2.59 kV.
- Sparks at the floor (3 kV or less): HighSpark Premium 9.8%, HighSpark Standard 36.1%, OEM 84.5%.
- Ranking: HighSpark Premium first, HighSpark Standard second, OEM third.
- OEM's problem is not a noisy spark. It is a spark that drops to the floor and stays there.
- No horsepower, torque, fuel economy, misfire or drivability claims. A parked spark capture can't show those.
All raw analyzer files are published in section 8.
1. Introduction
Every coil has one job. Fire a clean, reliable spark every time the engine asks for one. The real question is how well it keeps doing that as RPM climbs. So we tested three coil concepts side by side: the factory (OEM) coil, HighSpark Standard (the street version) and HighSpark Premium (the race version).
Our first case study and data source is a 2022 Toyota Tacoma TRD Off-Road with the 3.5L V6. One spark analyzer, one truck, all three coil sets. It's one data point. More vehicles are planned for this series.
This paper covers what we did, how we cleaned the data, what the numbers show and, just as important, what they don't show. The raw analyzer files are public so anyone can check our work.
Short version: on the Tacoma, parked and revved through its range, both HighSpark coils held a measurable spark at high RPM. The OEM coils mostly dropped to the analyzer's floor. HighSpark Premium first, HighSpark Standard second, OEM third.
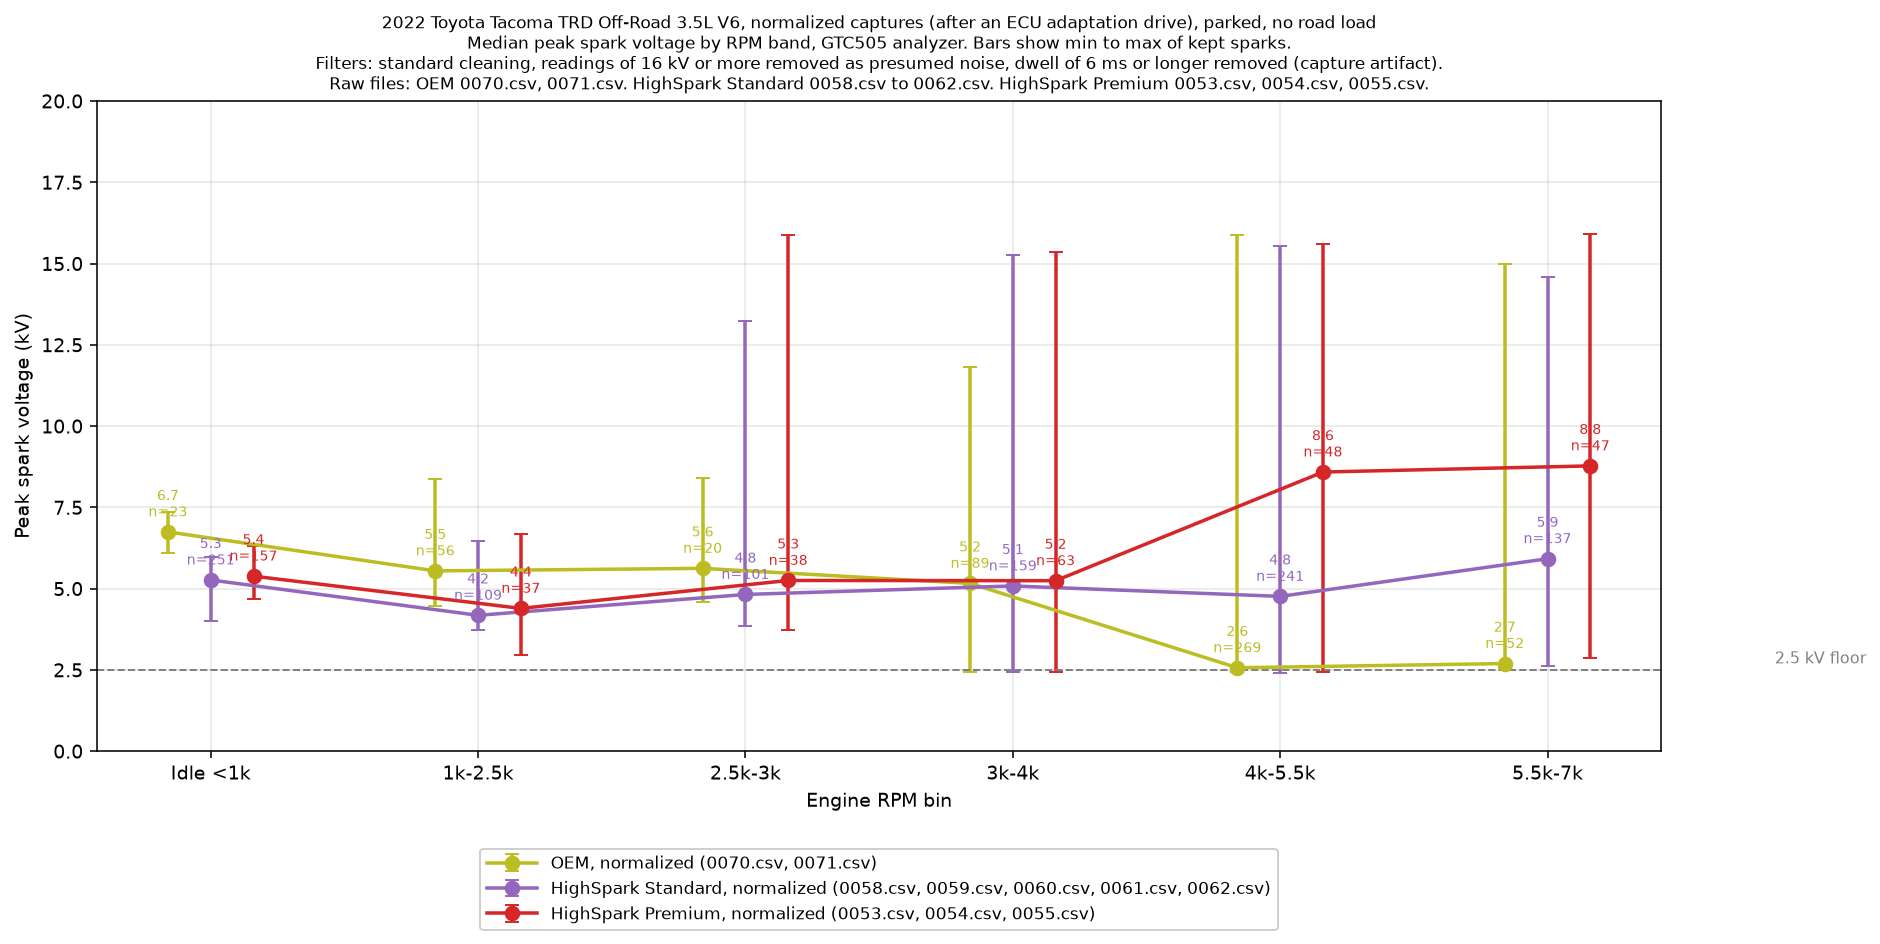
Figure 3. Median peak spark voltage by RPM band for OEM (0070.csv, 0071.csv), HighSpark Standard (0058.csv to 0062.csv) and HighSpark Premium (0053.csv to 0055.csv), normalized captures, parked, no road load.
2. Test setup
- Vehicle: one 2022 Toyota Tacoma TRD Off-Road with the 3.5L V6, our first case study, tested at 50,011 miles with fresh oil from a change less than 500 miles before testing and a fresh Optima Yellow Top battery about a month old.
- Coils: factory OEM coils, HighSpark Standard coils and HighSpark Premium coils.
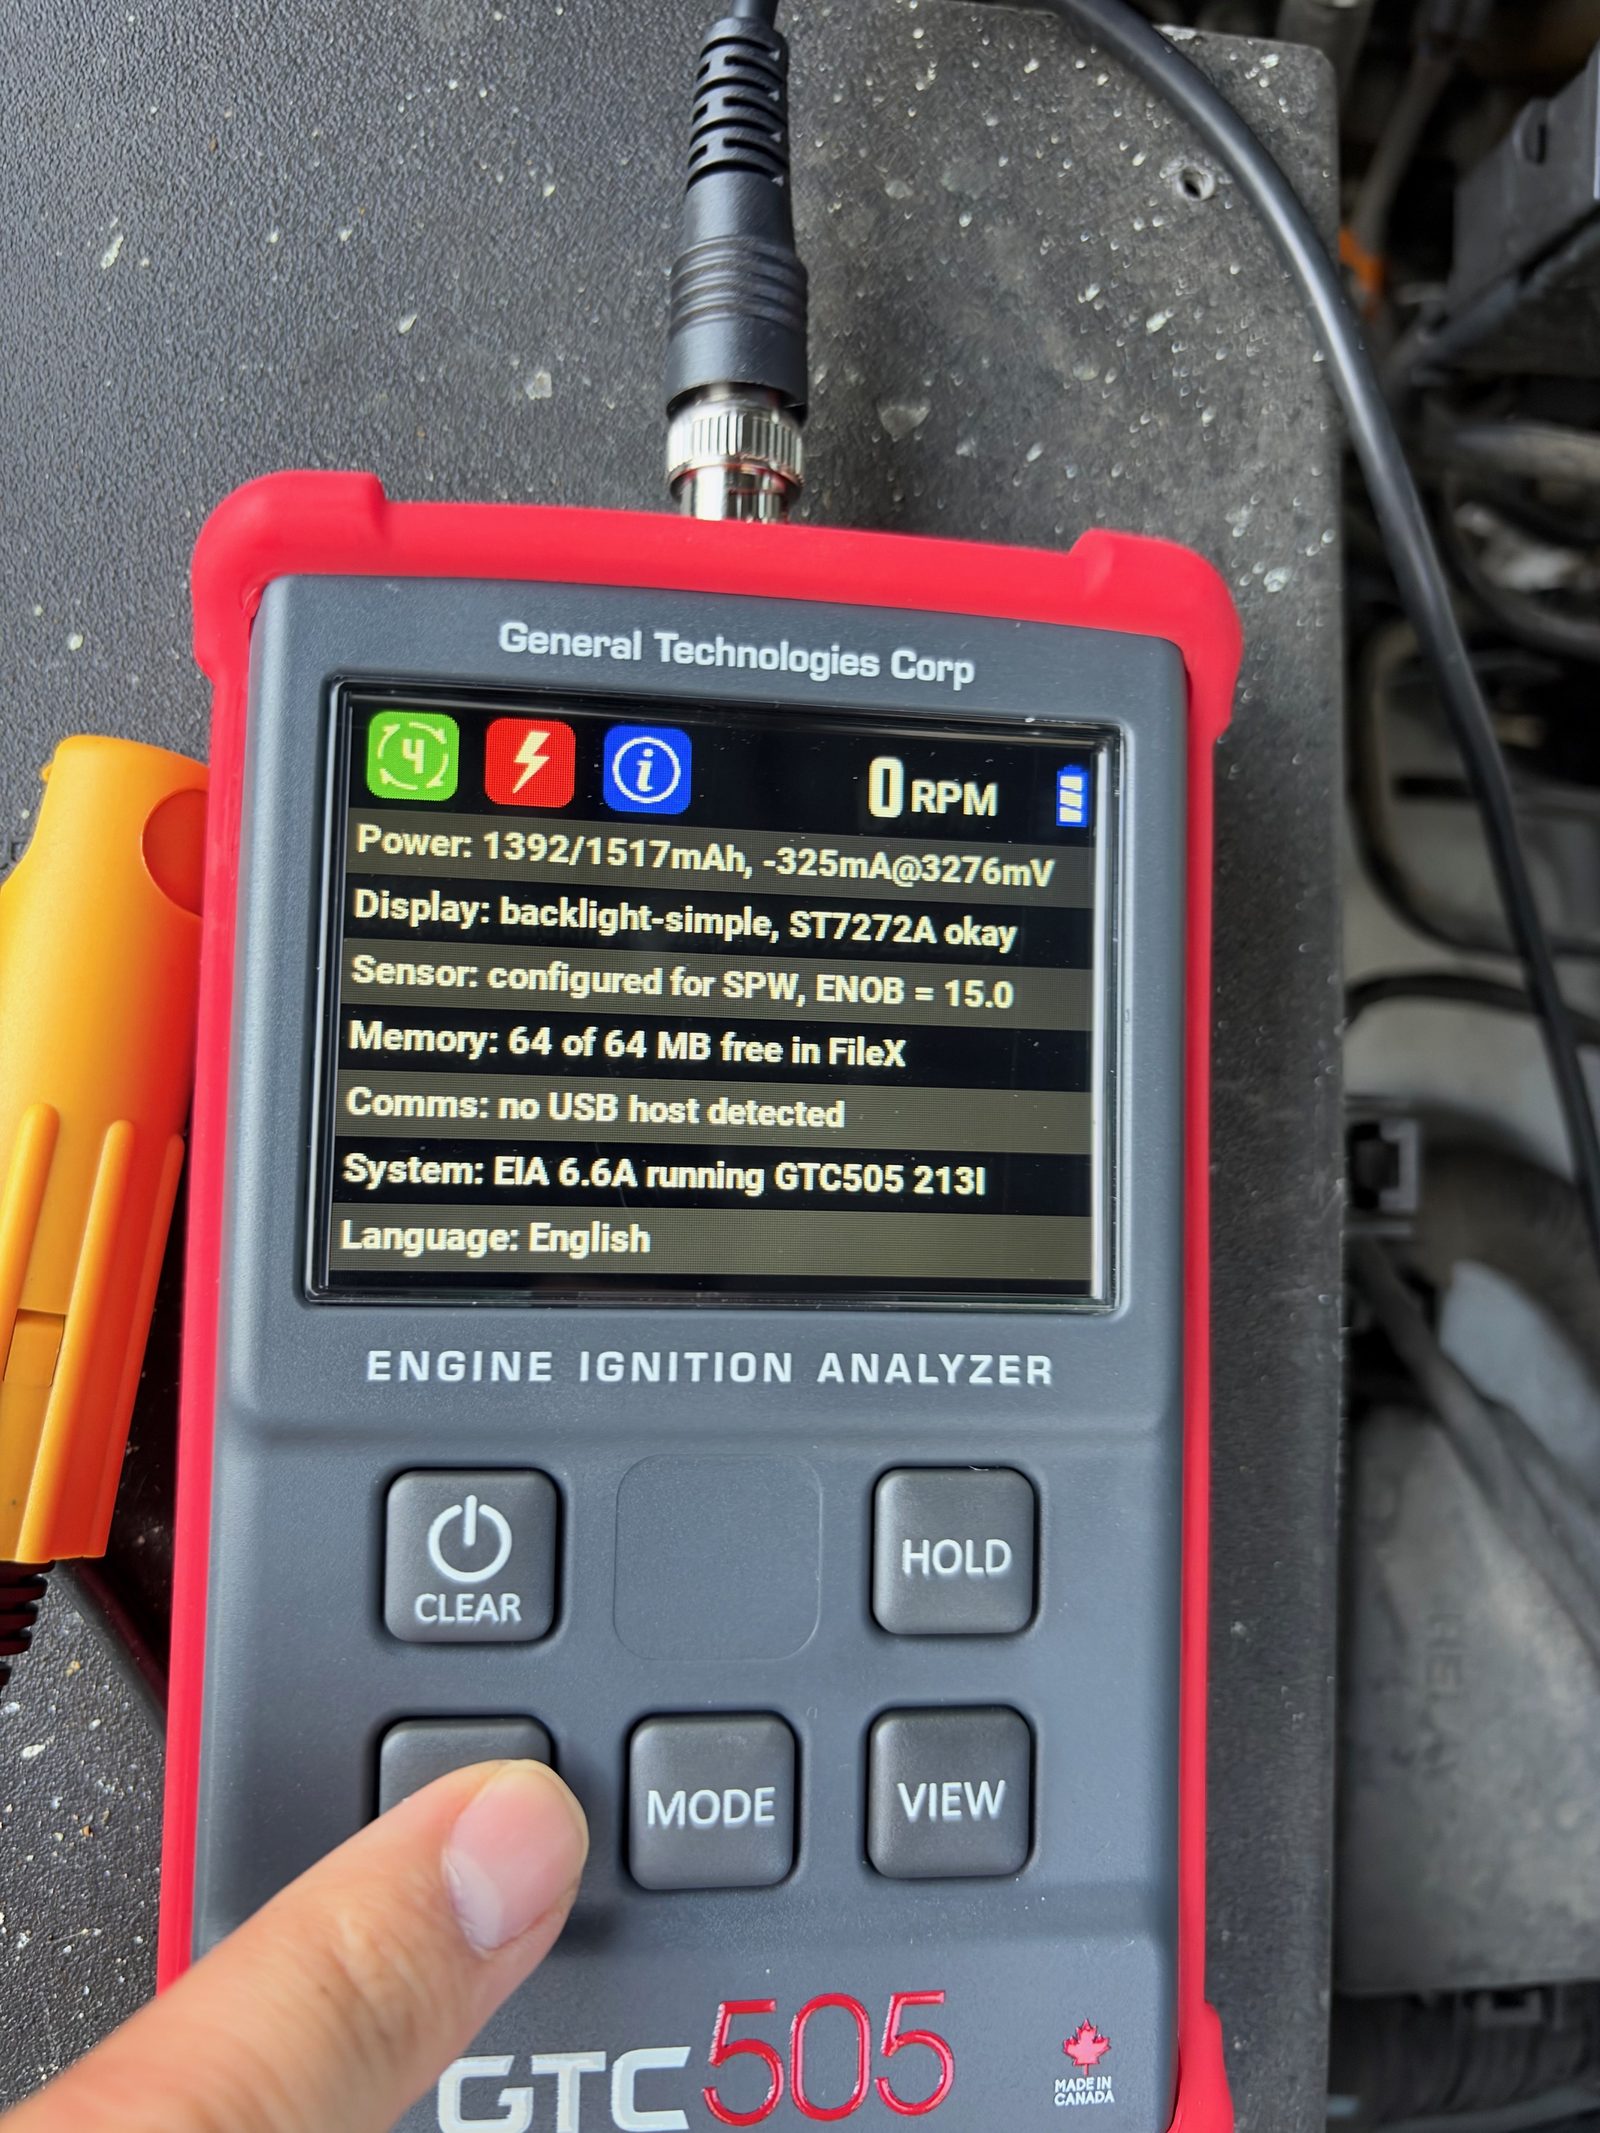
- Instrument: a GTC505M engine ignition analyzer in coil-pack mode. Each capture records 300 sparks: engine speed (RPM), dwell time, peak voltage and burn time for every spark.
- Conditions: truck parked, no road load, engine revved from idle up through the upper RPM range.
2.1 Baseline and normalized captures
Modern engines learn. After a coil change, the ECU (engine computer) adapts its learned values over a drive cycle. To compare coils fairly we took two kinds of capture:
- Baseline (before ECU normalization): taken soon after a coil set went in, before the ECU had a chance to adapt.
- Normalized (after a drive cycle allowing the ECU to adapt and normalize): after each coil set went in, the truck was driven for about 15 minutes so the ECU's adaptive learning could settle. Then it was parked and the normalized measurements were taken with no load.
The main comparison uses the normalized captures for all three coil sets. Every coil is measured in the same state. Baseline numbers show up only where they help explain a result.
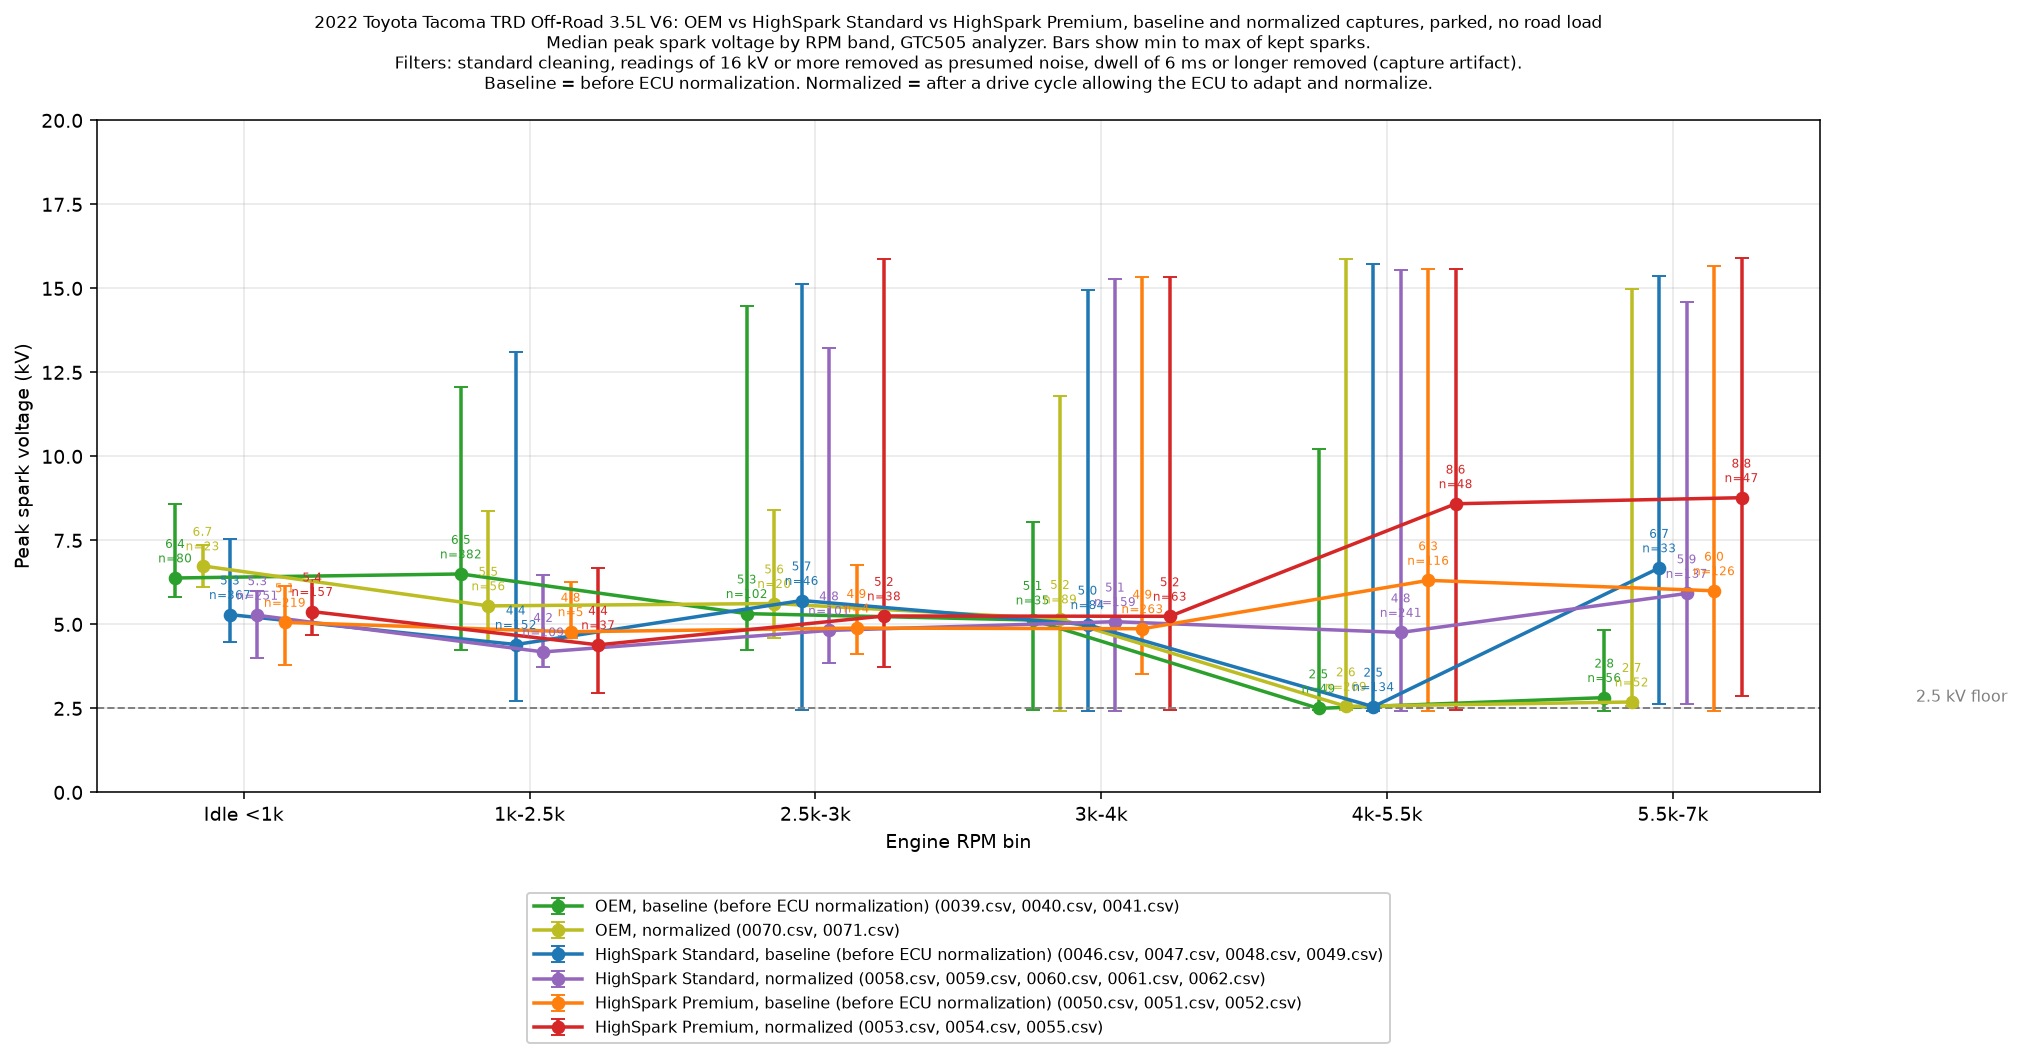
Figure 4. All six capture sets, baseline (before ECU normalization) and normalized, as median peak spark voltage by RPM band. Each series lists its source CSV files in the legend.
2.2 Installation note: let the ECU normalize
Going from factory coils to HighSpark coils is a big change in ignition characteristics. The ECU needs time to adjust. After each install, we drove the truck through a normal drive cycle before recording the normalized measurements.
If the engine stalls when it's first started and left to idle after install, reset the ECU so it can relearn the air fuel ratio (follow the vehicle's service procedure). Then complete a drive cycle before judging idle or taking measurements. In our test, the engine briefly stalled at idle right after the HighSpark Standard coils went in. Once the ECU was reset and allowed to relearn, it held a steady idle. We read that as a sign of how much the new coils changed the ignition. The ECU's stored adaptations no longer matched and had to be rebuilt. Put simply, the shift in ignition behavior was big enough that the ECU at first had difficulty compensating for it with the values it had learned on the factory coils.
2.3 Why parked, with no road load
We first tried the analyzer on a 2.5 meter extension cable so we could measure the truck under road load. That signal wasn't clean enough to trust. We also compared the extension cable against the long probe attached directly to the GTC505M, and the direct probe gave a cleaner signal. Parked testing was safer and much cleaner, so every capture here was taken parked, with no road load. A loaded test with a better cable setup is planned for a later session.
2.4 Which files are in each set
- HighSpark Premium, normalized: GTC505_trends_0053.csv, GTC505_trends_0054.csv, GTC505_trends_0055.csv.
- HighSpark Standard, normalized: GTC505_trends_0058.csv through GTC505_trends_0062.csv (five files).
- OEM, normalized: GTC505_trends_0070.csv and GTC505_trends_0071.csv.
3. Methodology
3.1 Method at a glance
- Sample size (normalized sets, after cleaning): OEM 509 sparks (0070 and 0071), HighSpark Standard 998 sparks (0058 to 0062), HighSpark Premium 390 sparks (0053 to 0055).
- Cleaning: we dropped readings at or below 300 RPM or at or above 7,000 RPM, zero dwell, exactly 2,400 V, RPM more than 40% off a centered 9 spark rolling median, 16 kV or more, and dwell of 6 ms or more.
- Dead zone: any reading at 3 kV or less. That is the analyzer floor. Floor readings bunch up just above 2.4 kV: median 2.54 kV, and 90% of them sit between 2.45 and 2.83 kV.
- Noisiness, defined: the spread of a coil's peak voltage inside each 100 RPM step. We measure it as the interquartile range (IQR), the gap between the 25th and 75th percentile readings, in each 100 RPM bin with at least 3 sparks, then average across bins weighted by spark count.
- What it shows: above 3,800 RPM the IQR is OEM 0.40 kV, HighSpark Standard 4.08 kV, HighSpark Premium 3.45 kV. By this measure OEM is not noisier. Its readings look tight because most of them are sitting on the floor. OEM's real problem at high RPM is dropping to the floor: 84.5% of its sparks above 3,800 RPM landed in the dead zone, against 36.1% for HighSpark Standard and 9.8% for HighSpark Premium.
3.2 Captures we set aside
Some captures didn't make the cut. Here's why. The first OEM normalized attempt was too noisy at capture: across those seven files there were 18 instrument error codes, 51 readings at or above 7,000 RPM and two completely blank files. That's a setup problem, not a coil result, so the OEM normalized set was captured again. The redo was clean, with zero error codes and zero impossible RPM readings. That redo is the OEM data used here. Two HighSpark Premium full-RPM runs were left out for the same kind of instrument glitch (RPM readings as high as 160,714 and repeated error codes). A third OEM redo file turned out to be a shifted copy of another capture, so it wasn't counted twice.
3.3 Cleaning rules
Analyzers pick up noise. Every capture was cleaned the same way. The raw files are never edited; cleaning happens only in the analysis.
- Dropped readings at or below 300 RPM or at or above 7,000 RPM.
- Dropped readings with zero dwell (blank sparks).
- Dropped readings of exactly 2,400 V, which we treat as an instrument error code.
- Dropped readings whose RPM jumped more than 40% away from the surrounding readings (a 9-spark rolling median).
- Dropped readings of 16 kV or more. They sit far outside everything else and are treated as presumed sensor noise.
- Dropped readings with a dwell of 6 ms or longer. About 95% of sparks in this test had a dwell of 2 or 3 ms. A separate cluster near 7 ms came with unusually high voltage, mostly in the 2,500 to 3,000 RPM band, and looks like a capture artifact.
3.4 The dead zone
Readings at or below 3 kV count as the detection floor. The analyzer bottoms out near 2.5 kV. A reading there means the analyzer didn't see a meaningful spark voltage. We report the floor share for every set because it turned out to be one of the clearest differences between the coils.
3.5 Summaries and smoothing
Sparks are grouped into RPM bands: idle under 1,000 RPM, then 1,000 to 2,500, 2,500 to 3,000, 3,000 to 4,000, 4,000 to 5,500 and 5,500 to 7,000. We report the median peak voltage in each band. The median shrugs off stray spikes better than an average does.
For the smoothed charts, each point on the curve is a weighted average of nearby sparks. Sparks closer in RPM count more (a bell-shaped weighting about 350 RPM wide). The curve is then lightly averaged again so it reads as a trend, not a scribble. The individual sparks are plotted faintly behind the lines so you can see the real spread.
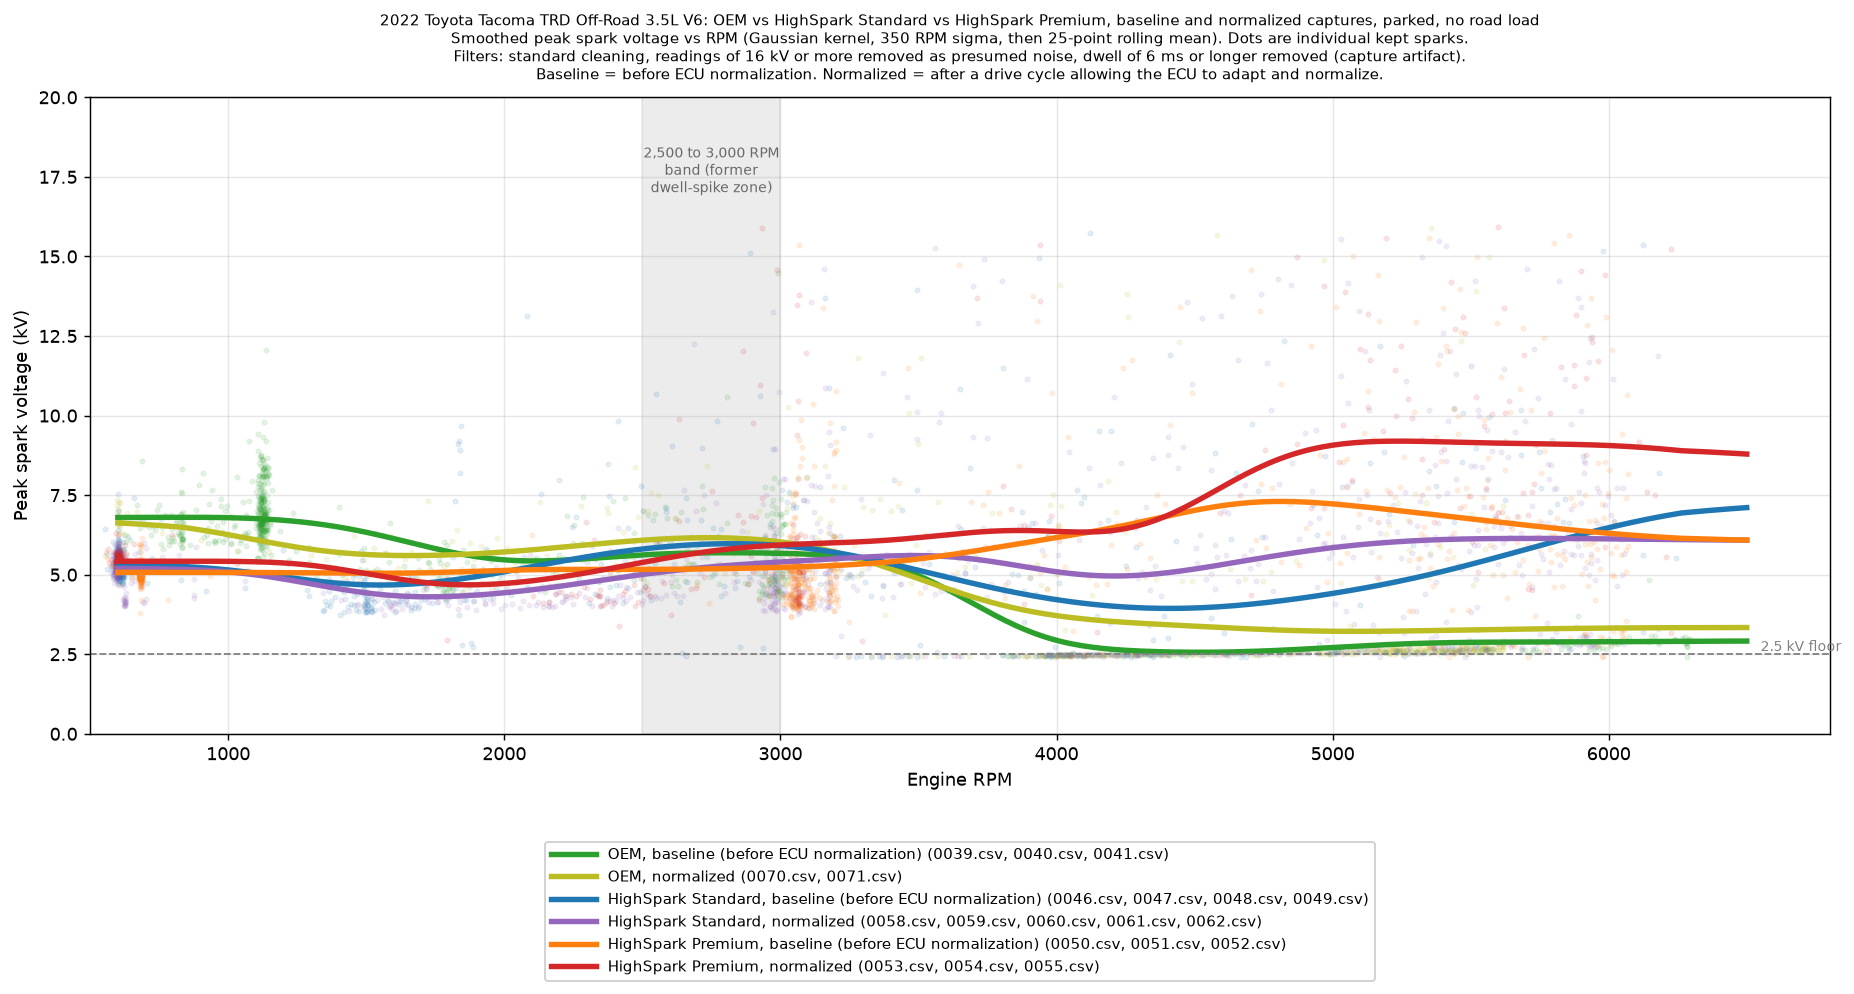
Figure 5. The smoothing method applied to all six capture sets, baseline (before ECU normalization) and normalized, with each series' source CSV files in the legend.
4. Results
4.1 Above 3,800 RPM: where the coils split
At idle and low RPM, all three coil sets read in about the same window, roughly 4 to 7 kV. The difference is in the upper rev range. Above 3,800 RPM, normalized captures:
Table 1. Normalized captures, above 3,800 RPM.
| Coil set (normalized) | Median peak voltage | Readings at the floor | Sparks counted |
|---|---|---|---|
| HighSpark Premium | 8.26 kV | 9.8% | 102 |
| HighSpark Standard | 5.31 kV | 36.1% | 393 |
| OEM | 2.59 kV | 84.5% | 355 |
In plain numbers: about 9 in 10 HighSpark Premium readings above 3,800 RPM showed a measurable spark voltage. HighSpark Standard managed roughly 2 in 3. OEM managed about 1 in 7. The OEM median sits right on the analyzer floor.
This isn't a one-off from the OEM redo. The OEM baseline captures say the same thing: above 3,800 RPM the OEM baseline median was 2.62 kV, with 92.0% of readings at the floor.
4.2 The 4,000 to 5,500 RPM band
This is where the gap is widest. Normalized medians: 8.59 kV for HighSpark Premium (16.7% at the floor, 48 sparks), 4.76 kV for HighSpark Standard (43.2% at the floor, 241 sparks) and 2.56 kV for OEM (85.9% at the floor, 269 sparks). Both HighSpark sets kept reading above the floor through this range. Most OEM readings sat on it.
Figure 6 puts the three coils side by side in this one band. Every dot is one real spark reading from the analyzer files. This is built from per-spark peak voltage readings, not true waveforms: the GTC505M trend files record one peak voltage per spark, not voltage over time. The grey area is the dead zone. Watch the OEM sparks stack up on the floor.
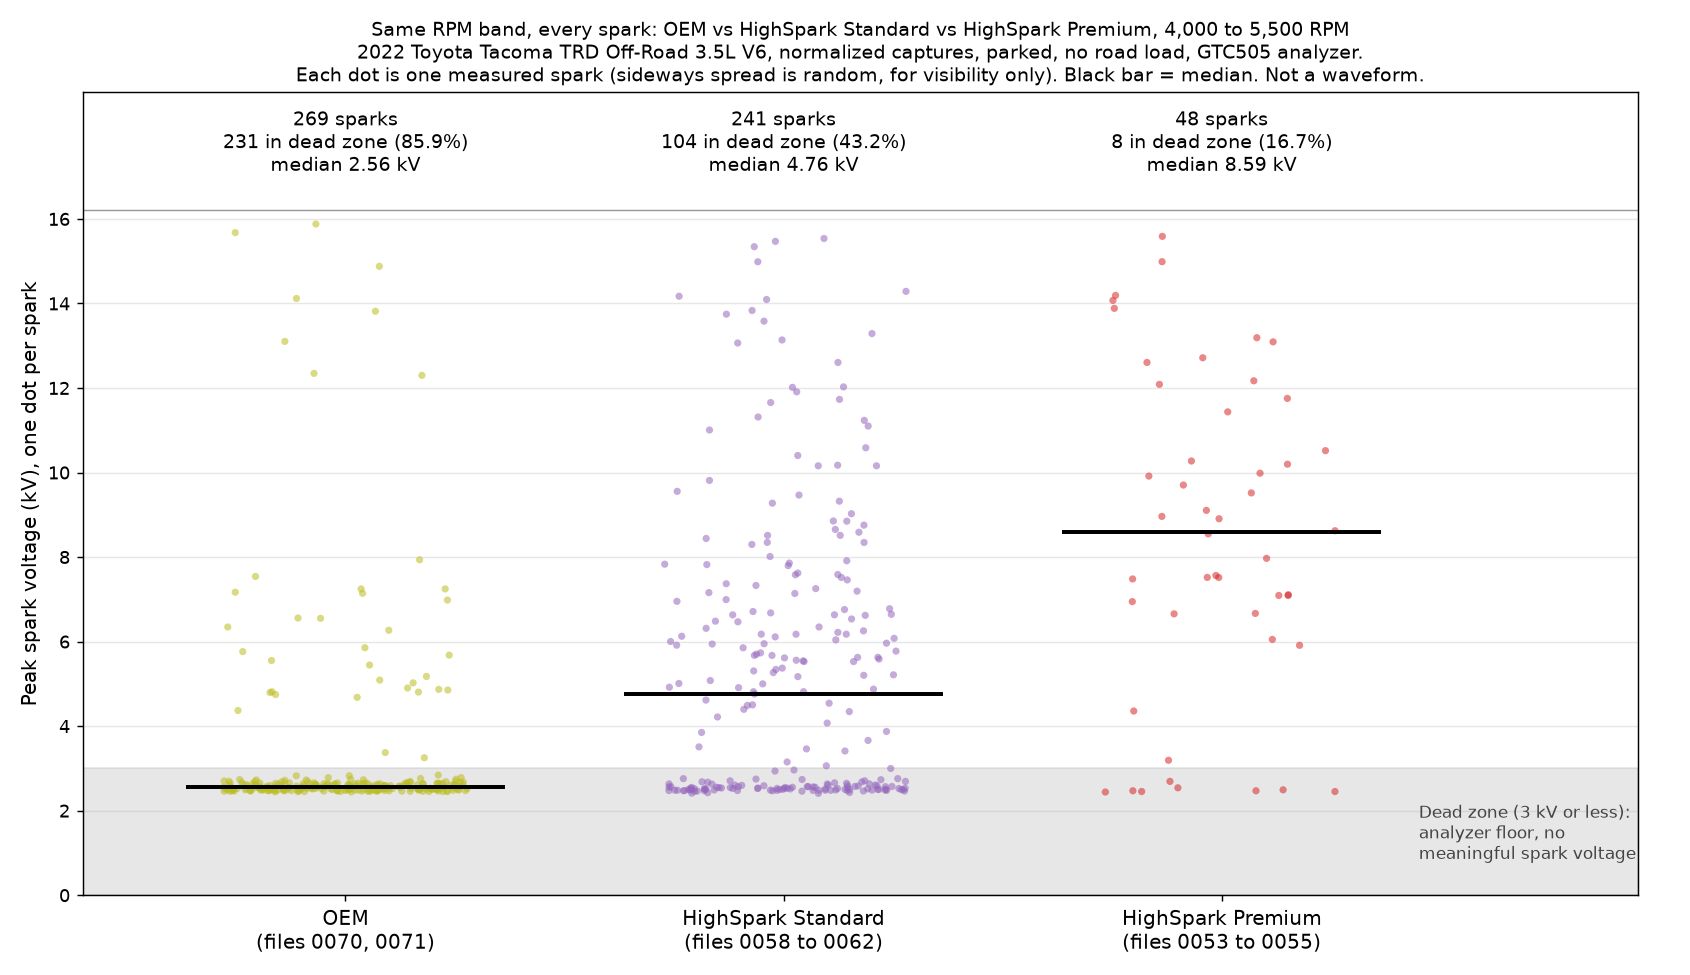
Figure 6. Same RPM band, every spark: all normalized sparks between 4,000 and 5,500 RPM for OEM (269 sparks, 231 in the dead zone), HighSpark Standard (241 sparks, 104 in the dead zone) and HighSpark Premium (48 sparks, 8 in the dead zone). Built from real per-spark readings, not true waveforms. Sideways spread is random, for visibility only; black bar is the median.
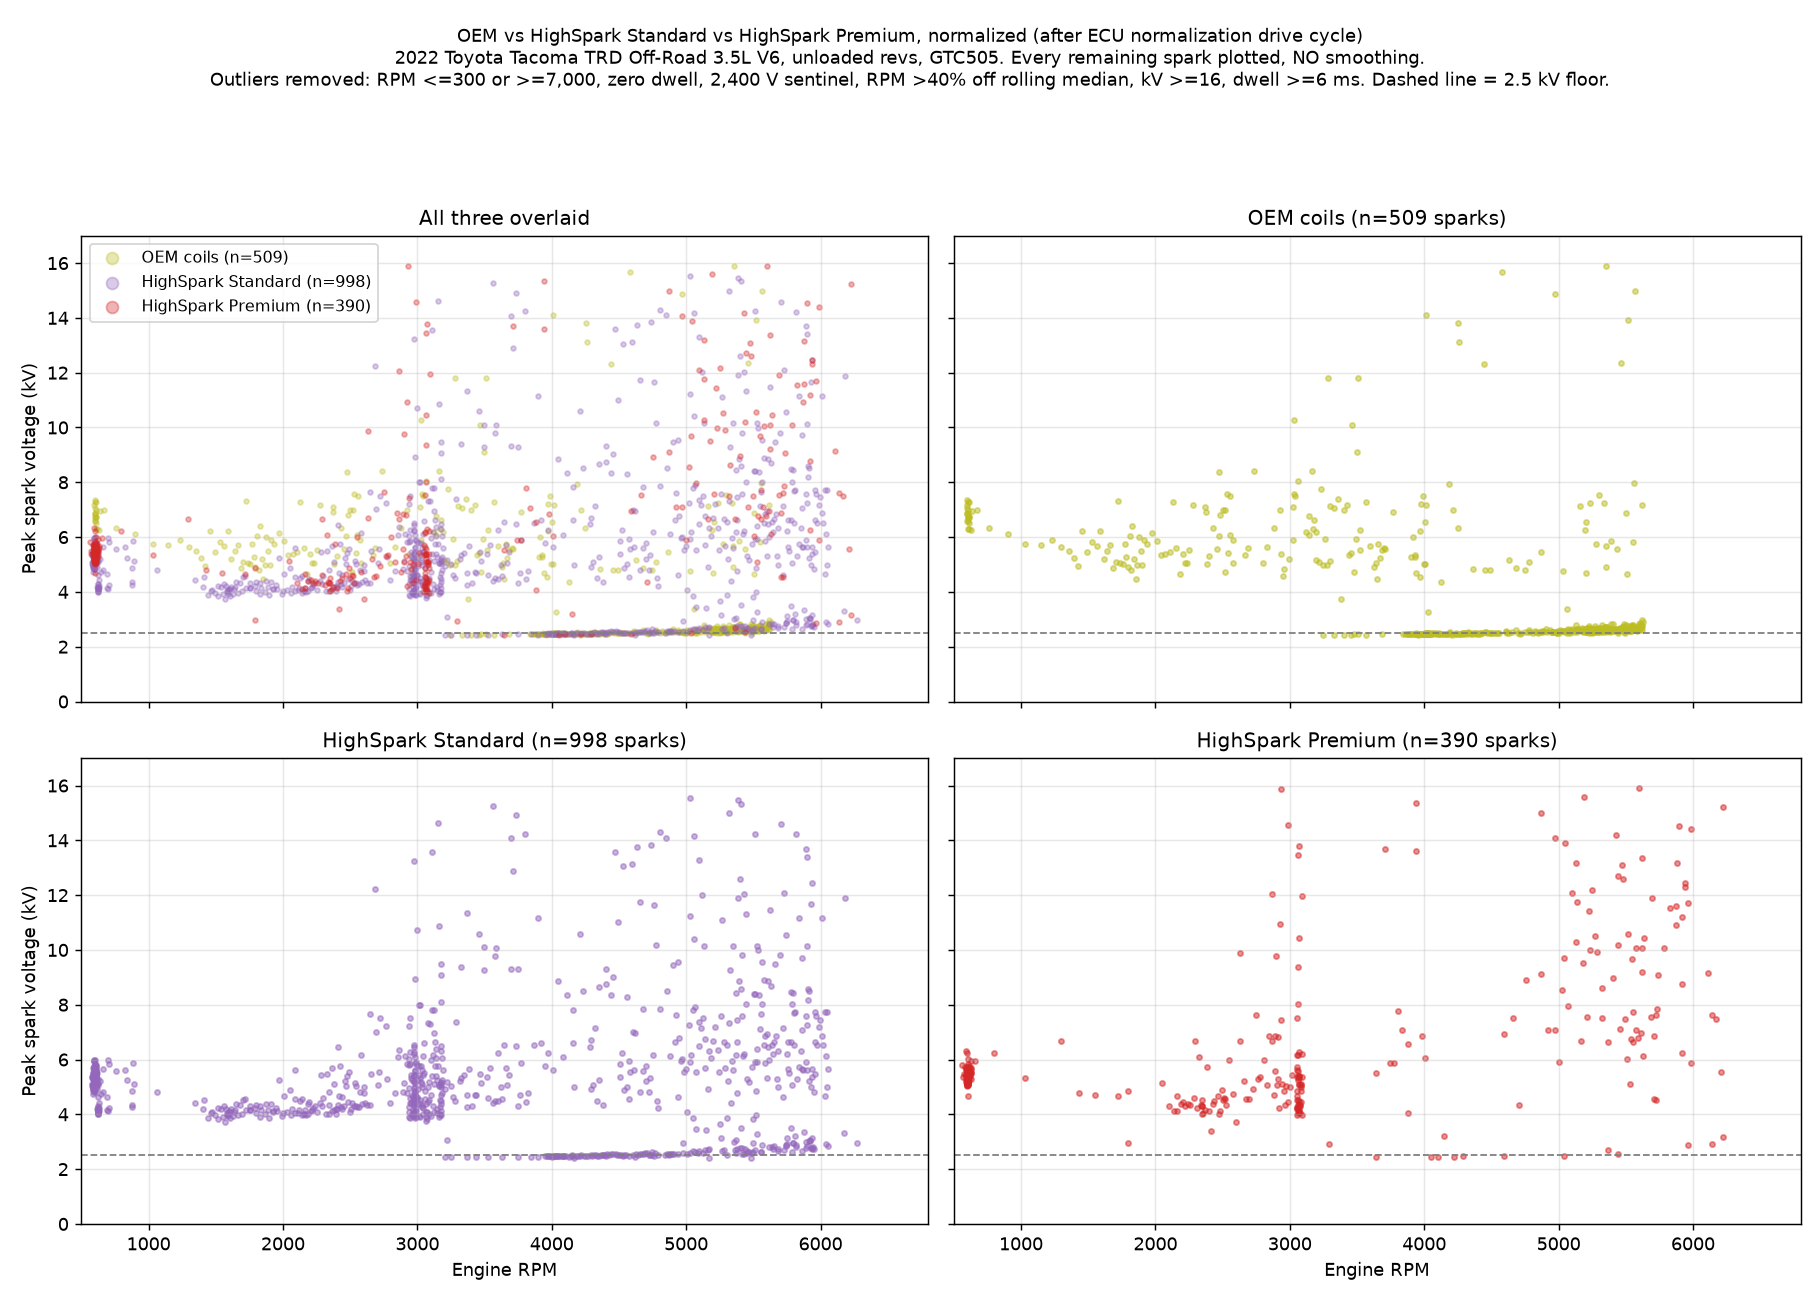
Figure 7. Raw view: every remaining normalized spark plotted as a point, no smoothing (OEM 509 sparks from 0070.csv and 0071.csv, HighSpark Standard 998 from 0058.csv to 0062.csv, HighSpark Premium 390 from 0053.csv to 0055.csv).
The smoothed view of these same normalized captures is Figure 1, at the top of this page. That chart compresses the 0 to 2.5 kV band into the bottom 10% of the axis so the 2.5 kV analyzer floor reads as a floor.
4.3 HighSpark Premium held up after normalization
Above 3,800 RPM, the HighSpark Premium median was 6.05 kV in the baseline captures and 8.26 kV in the normalized captures. The floor share dropped from 14.1% to 9.8%. After a drive cycle the Premium coils showed no sign of fading. The reading went up. (The baseline HighSpark captures were saved with the analyzer in a different cycle mode, which mainly changes how it calculates RPM. So this is a supporting observation, not a headline number.)
4.4 Idle: a shift, not an advantage
At idle, OEM read about 1.4 kV higher than either HighSpark set (normalized medians: OEM 6.74 kV, HighSpark Standard 5.27 kV, HighSpark Premium 5.38 kV). The OEM idle sample is small (23 sparks). The difference looks like a steady offset, not a wider or shakier spread. Peak voltage reflects how much voltage the plug gap needs at that moment, so a higher idle number isn't a benefit or a drawback by itself. We don't draw a conclusion from it.
5. What it means
For the coil concept as a whole, the Tacoma data points one way. The three coils split where ignition is hardest to sustain, in the upper rev range. And they split in the order of the product tiers. That's the pattern you'd expect if a coil built with more headroom does what it's built to do. It's the pattern we'll be looking for on every vehicle we test next.
What this parked, no-load Tacoma study supports:
- A stronger measured spark at high RPM. Above 3,800 RPM: HighSpark Premium 8.26 kV, HighSpark Standard 5.31 kV, OEM 2.59 kV.
- A more consistent spark. Above 3,800 RPM, only 9.8% of HighSpark Premium readings and 36.1% of HighSpark Standard readings hit the floor. OEM: 84.5%.
- Readings that stay off the floor through 4,000 to 5,500 RPM, where most OEM readings sat at the floor.
- Holds up after normalization. HighSpark Premium read higher in its normalized captures than in its baseline captures.
- A clear good, better, best lineup. HighSpark Premium first, HighSpark Standard second, OEM third in the upper rev range.
Possible benefits this study did not measure:
- Timing advance for tuners. A stronger and more consistent spark may leave more room to advance timing, particularly when paired with high octane fuel. HighSpark Premium here is the race coil, not a fuel grade, and this test did not use a different fuel.
- Spark plug life. A steadier burn may mean less fouling and fewer deposits, which could extend spark plug life.
- Smoother idle. More consistent combustion may produce a smoother idle.
- Cleaner catalytic converters. Fewer unburned hydrocarbons reaching the exhaust may help keep catalytic converters cleaner.
- Cold starts. A stronger and more consistent spark may improve cold-start behavior.
- Compression and boost. A stronger and more consistent spark may help support running higher compression or boost without detonation, with proper tuning and fuel, which may open the door to more power from the same hardware. Spark alone does not prevent detonation.
This study did not test timing changes, spark plug life, idle quality, emissions, cold starts, or compression and boost, so treat those as a direction for future testing.
One-line summary: in our testing on the Tacoma, HighSpark coils maintained spark strength and consistency at higher RPM compared with the stock coils, measured with the truck parked and no load.
Driving a different year, make or model? These numbers come from one Tacoma. Don't read them as numbers for your engine. Results on other engines may differ, which is exactly why more vehicles are planned. In the meantime, contact us with your year, make and model to check HighSpark fitment for your vehicle.
Why HighSpark coils are sold as a full set: see our post on HighSpark ignition coils and matched kits.
6. Limitations
This is only useful if the limits are clear. Here they are.
- Parked, no road load. Every capture was taken parked. This shows spark behavior while revving, not while driving.
- One truck. All results come from a single 2022 Tacoma TRD Off-Road 3.5L V6. Other vehicles, mileage and plug condition could behave differently.
- No horsepower, torque, fuel economy, misfire or drivability claims. A parked spark capture can't show any of those, and we're not making them.
- Peak voltage is demand, not coil capacity. The analyzer measures the voltage the plug gap needed to fire. Higher readings and fewer floor readings are what we observed. They are not a direct measurement of coil output.
- Unrecorded conditions. Ambient conditions, spark plug type and gap, and probe position were not recorded.
- Our own cutoffs. The cleaning thresholds (2,400 V error code, 16 kV, 6 ms dwell, 3 kV floor) and the RPM bands are our choices, documented above. They are not published instrument specifications.
- Dwell assumption. We assume dwell on this engine is controlled by the ECU, not the coil, so coil differences show up as voltage delivery. We did not independently verify that.
- Uneven sample sizes. Some bands have fewer sparks than others. For example, HighSpark Premium has 48 kept sparks in the 4,000 to 5,500 RPM band, all from one capture.
7. What we expect under load (hypothesis only)
Everything in this section is a hypothesis. It hasn't been measured. We're labeling it that way on purpose.
- Readings should rise for every coil. Under load the throttle is open and cylinder pressure is much higher, so the plug gap demands more voltage to fire. Parked readings in the 2.5 to 9 kV range could plausibly climb well into double digits under hard load.
- The gap between coils will likely widen. A coil with more headroom can keep up with higher demand. A weaker one runs out sooner. The OEM coils already sat at the floor at high RPM with no load, so they're the most likely to show weak sparks under load.
- The ranking should hold. We expect HighSpark Premium first, HighSpark Standard second and OEM third, possibly with sharper separation.
- Idle should change little, since an engine sees little real load at idle.
- The data will be noisier, because vibration and a longer cable add pickup noise. That's why a cleaner extension cable setup comes first.
The plan to verify this: a loaded road test or dyno session with the improved cable setup, ideally with misfire counts from an OBD scanner and back to back runs. Until then, treat this section as a prediction, not a result.
8. Raw data
For transparency, we're publishing the complete, unedited capture files behind every chart and figure in this study. Anyone can review the raw measurements and check our analysis.
These are the unmodified analyzer files used in the charts above, so you can rerun the analysis yourself. Each file is a byte for byte copy of the original export.
- HighSpark Premium, normalized: GTC505_trends_0053.csv, GTC505_trends_0054.csv, GTC505_trends_0055.csv
- HighSpark Standard, normalized: GTC505_trends_0058.csv, GTC505_trends_0059.csv, GTC505_trends_0060.csv, GTC505_trends_0061.csv, GTC505_trends_0062.csv
- OEM, normalized: GTC505_trends_0070.csv, GTC505_trends_0071.csv
- Note: HighSpark Standard corresponds to the files labeled Regular in our data folders and in the README.
- All ten files in one zip, with a README (column meanings, set names, test conditions) and SHA-256 checksums: highspark_tacoma_gtc505_raw_data.zip
Reading the files: row 1 is the instrument header and row 2 lists column names. Row 2 starts with "Spark Index", but the data columns are, in order: engine speed (RPM), dwell (ms), peak voltage (V, usually negative; we use the absolute value divided by 1,000 as kV) and burn time (ms). A fifth column is always 0.00 and unused.
9. Conclusion
Coils are easy to talk about and hard to measure. So we measured. In this first case study, a parked, no-load GTC505M study of one 2022 Toyota Tacoma TRD Off-Road 3.5L V6, HighSpark Standard and HighSpark Premium kept a measurable, more consistent spark in the upper rev range. The factory coils mostly fell to the analyzer floor. HighSpark Premium was strongest, HighSpark Standard second, OEM third.
One truck is a starting point, not a verdict for every engine. Next: a loaded test on the Tacoma, then more vehicles across other years, makes and models. Each one gets reported the same way: method, charts, limits and raw data. Want to know what this could mean for your vehicle? Check HighSpark fitment for it and follow the series as it grows.
Appendix: Why we measure spark voltage in kV
Spark voltage is measured in kilovolts (kV), and it is one of the standard numbers used to test and diagnose ignition systems. Engineering research measures the voltage needed to start a spark in kV [1]. SAE International publishes a recommended practice, SAE J973, that sets out test bench procedures for measuring ignition systems [2]. Shop ignition analyzers, including the GTC505M used in this study, report spark plug peak voltage in kV. The GTC505M measures from 1.5 to 50 kV [3].
Two different voltages matter, and it helps to keep them apart.
- Required voltage. This is the voltage it takes for the spark to jump the plug gap, also called breakdown or firing voltage. It depends on the size of the gap and on the pressure, temperature and makeup of the gas in the cylinder [1]. This is what an analyzer reads as peak voltage on a running engine. It tells you what the gap demanded at that moment. It is not a measure of how strong the coil is.
- Available voltage. This is the most voltage the ignition system can supply. It is measured on a test bench with procedures like SAE J973 [2]. We did not measure it in this study.
The difference between the two is the voltage reserve, or headroom. Reserve is what keeps a spark firing when the job gets harder. As spark plug electrodes wear, the gap grows and the required voltage rises [4][5]. Once the required voltage is more than the ignition system can supply, the spark can no longer jump the gap, and misfires become more likely [4]. Higher cylinder pressure, such as under load or boost, also raises the required voltage [1]. An early Champion Spark Plug Company study found that high output ignition systems give a higher voltage reserve, which supports longer spark plug life [6].
What this means for reading our results:
- The kV numbers in this paper are peak readings, which reflect required voltage at each spark. They show how each coil set's sparks registered on the analyzer with the truck parked and no load.
- A higher peak reading does not by itself mean a stronger spark, and a low reading does not by itself mean a weak or missing spark. The GTC505M manual notes that peak voltages "may vary widely, are less consistent and not always indicative of a properly working ignition system" [3].
- We did not measure each coil's available voltage, so this study does not report voltage reserve directly.
References
- Pashley, N., Stone, R. and Roberts, G. (2000). Ignition System Measurement Techniques and Correlations for Breakdown and Arc Voltages and Currents. SAE Technical Paper 2000-01-0245. https://doi.org/10.4271/2000-01-0245
- SAE International (2026). SAE J973_202603, Ignition System Measurements Procedure. SAE Recommended Practice, published March 11, 2026. https://www.sae.org/standards/j973_202603-ignition-system-measurements-procedure/
- GTC. GTC505 Engine Ignition Analyzer user manual (GTC505EMN2608EN), specifications and section 6.6, Peak Voltage. https://gtc.ca/wp-content/uploads/2026/08/GTC505EMN2608EN.pdf
- Breden, D., Karpatne, A., Suzuki, K. and Raja, L. (2019). High-Fidelity Numerical Modeling of Spark Plug Erosion. SAE Technical Paper 2019-01-0215. https://doi.org/10.4271/2019-01-0215
- Tambasco, C., Hall, M.J. and Matthews, R. (2024). Effects of Spark Plug Operating Conditions on Electrode Erosion and Surface Deformation. SAE Technical Paper 2024-01-2100. https://doi.org/10.4271/2024-01-2100
- Teasel, R.C. and Miller, R.D. (1967). Characteristics of New Ignition Systems to Improve Engine Performance. Proceedings of the Institution of Mechanical Engineers, Automobile Division, 182. https://doi.org/10.1243/PIME_AUTO_1967_182_009_02